
Finding Area Between Two Curves Without the Headache
Mar 5, 2026

Finding the area between two curves sounds like one of those calculus topics designed to be confusing, but I promise you, it's not. The whole concept really boils down to one simple idea: subtracting the 'bottom' curve from the 'top' curve and then integrating what's left.
Think of it as calculating the space trapped between two lines on a graph. Once you get the hang of setting up that one formula, you're pretty much golden for this part of your course.
Your No-Stress Guide to Nailing Area Between Curves
So, you've hit that point in the semester where your calculus homework is starting to look like a collection of cryptic puzzles. "Finding the area between two curves" is just the latest one. Take a breath. It's way more straightforward than the textbook makes it seem.
And this isn't just some random topic, either. It's a huge deal on exams like the AP Calculus test, popping up in an estimated 15-20% of free-response questions. Nailing this is a high-impact way to boost your score.
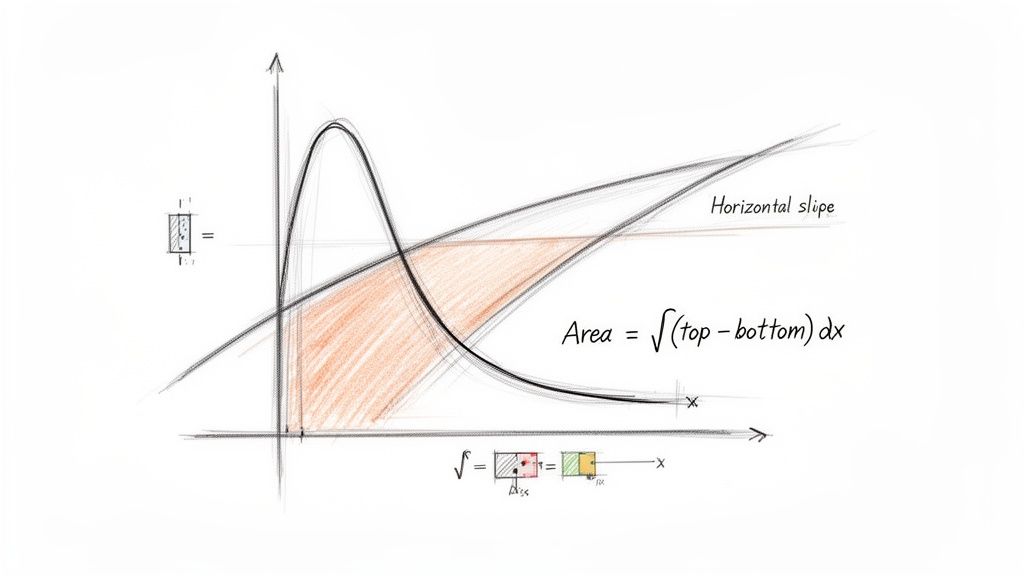
The main goal is to find the size of that shaded region squished between two functions, let's call them f(x) and g(x). All you have to do is figure out which function is sitting on top (the one with the greater y-value) and which one is on the bottom.
The Core Logic Made Simple
Imagine you're trying to fill that space between the curves with a bunch of incredibly thin, vertical rectangles. The height of any one of those rectangles is just the value of the top curve minus the value of the bottom curve. The integral is just a fancy way of adding up the areas of all those infinite, skinny rectangles.
Here's the game plan I always give my students:
Graph It Out: Seriously, always sketch the functions. It’s the single easiest way to see which curve is which and avoid the most common, frustrating mistakes.
Find the Boundaries: You need to know where the region starts and stops. That means finding where the curves cross paths. These intersection points are your limits of integration, 'a' and 'b'.
Set Up and Solve: Once you have the top function, the bottom function, and the boundaries, just plug them into the definite integral of (Top Function - Bottom Function) from 'a' to 'b'.
Pro Tip: If you're staring at your professor's confusing lecture slides and getting nowhere, don't spin your wheels for hours. An AI tool like Vivora can instantly turn that jumbled class content into a clear, personalized study guide, giving you a much better starting point.
This guide will walk you through this whole process, kicking things off with how to find those all-important intersection points. We'll also get into the two main strategies: using vertical slices (what we just talked about, integrating with x) versus horizontal slices (integrating with y). Sometimes, just flipping your perspective from vertical to horizontal can make a complete nightmare of a problem surprisingly simple.
And if you want to explore more about how AI can help you stay on top of your coursework, check out our guide on Vivora's AI study assistant.
Alright, let's talk about the first real hurdle you'll face when calculating the area between two curves. You've got the core idea down—it's all about "top curve minus bottom curve." But that formula is useless without a starting line and a finish line.
This is where things can get messy fast: finding where the curves actually intersect. Getting these boundaries, your a and b values for the integral, is the most important first step. If you nail this part, the rest of the problem is basically plug-and-chug. Get it wrong, and the whole thing falls apart.
The Algebraic Game Plan
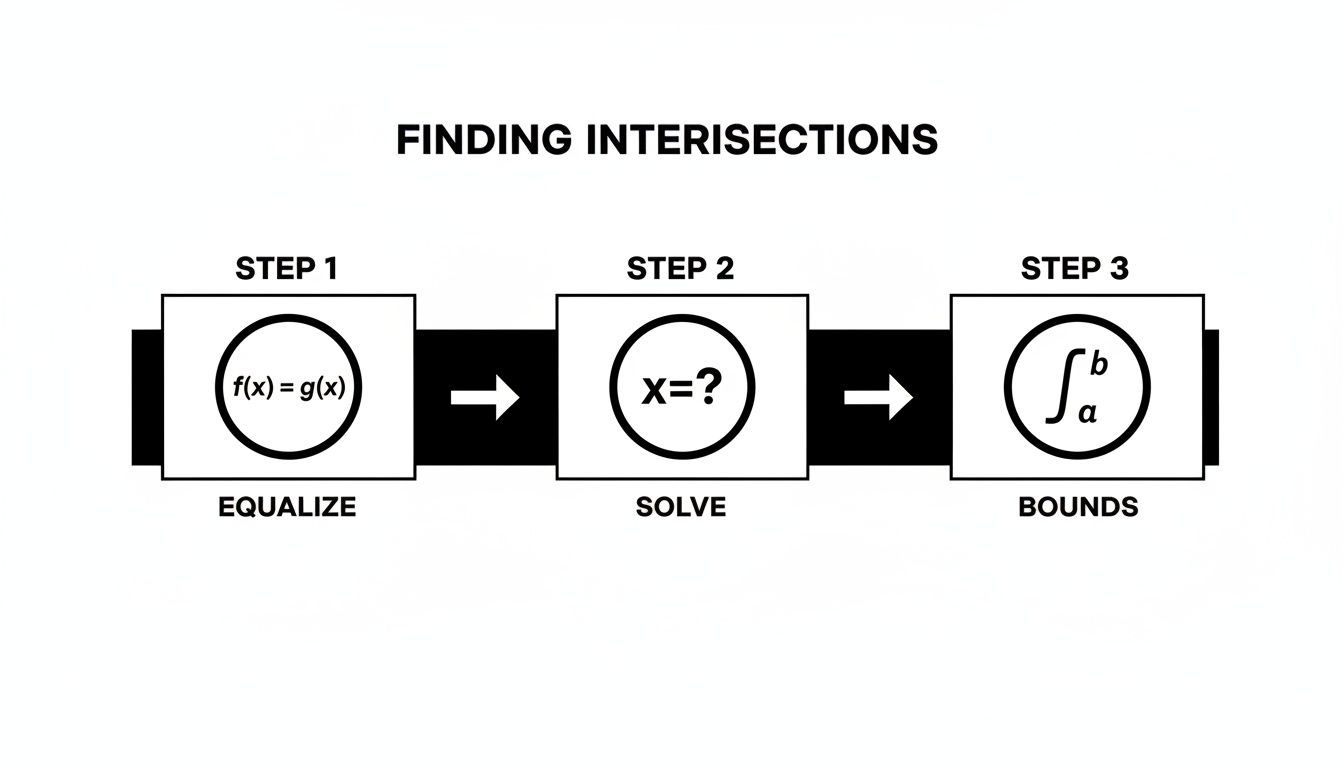
Finding where two functions cross paths sounds like a big calculus concept, but it's really just algebra you've seen a dozen times before. You literally just set the two equations equal to each other. If you have y = f(x) and y = g(x), you just need to solve the equation f(x) = g(x) for x.
The x-values you find are the exact coordinates where the graphs meet. These become the limits of your integral.
Let's walk through a classic example: finding the area trapped between a simple parabola y = x² and a line y = x + 2.
Set them equal:
x² = x + 2Make it a standard quadratic: Shove everything over to one side so it equals zero.
x² - x - 2 = 0Solve for x: Time to factor that thing.
(x - 2)(x + 1) = 0. This gives you two clean solutions: x = 2 and x = -1.
Boom. Those are your integration bounds. The entire region you care about is sandwiched between x = -1 and x = 2. See? Getting the boundaries right takes most of the anxiety out of the problem.
This is exactly the kind of step where a late-night study session can go off the rails. When you're staring at a problem at 1 AM and the algebra just isn't working, an AI helper is a lifesaver. With Vivora, you can upload a picture of the problem, and its AI chat will walk you through solving for the intersection points step-by-step. You can check your work and actually see where you went wrong.
When the Numbers Get Messy
Sometimes, life isn't as neat as a textbook problem. The intersection points might not be clean integers like -1 and 2. You could end up with some gnarly decimals or square roots that are a total pain to work with by hand.
In these moments, your graphing calculator is your absolute best friend.
Use the "intersect" function (it's usually under the CALC menu) to find the crossing points with perfect precision. For many courses, especially on the calculator-allowed sections of an exam, this isn't just permitted—it's expected.
Save your mental energy for the actual calculus—the setup and the integration. Don't burn yourself out on tedious algebra. Making this move is the key to working smarter, not harder.
Vertical vs. Horizontal Slices: Choosing Your Strategy
Alright, so you’ve figured out how to find where your curves intersect. Now comes the part that separates the rookies from the pros: choosing how to slice up the area you're measuring. This is less about just plugging numbers into a formula and more about thinking strategically to save yourself a massive headache.
Most of the time, you'll probably reach for vertical slices, which means integrating with respect to x. This is the classic "Top function - Bottom function" method that you see in most textbook examples. It works like a charm when one function stays neatly above the other across the entire area you care about.
But what happens when the curves cross over each other or get tangled up? You might find that the function on "top" suddenly becomes the "bottom" function halfway through your region. This is a huge pain. It forces you to stop, split your problem into two or more separate integrals, and then add everything up at the end. It's a recipe for small calculation errors that can cost you big points.
The Pro Move: Switching to Horizontal Slices
When a graph looks messy vertically, try turning your head 90 degrees and looking at it sideways. This is the magic of using horizontal slices and integrating with respect to y. Instead of thinking "Top - Bottom," you start thinking "Right function - Left function." This simple change in perspective can turn a complicated, multi-part problem into a single, clean integral.
Visual cues are everything here. If the functions are already defined in terms of y, like x = f(y) (think of a sideways parabola), that's a massive hint from the problem itself. Or, if you notice that one function consistently stays to the "right" of the other one—even if their top/bottom relationship is a mess—that's your signal to switch your thinking to dy.
This whole "Right - Left" vs. "Top - Bottom" thing can feel a little weird at first. It’s one of those calculus concepts you just have to drill until it becomes second nature. Instead of re-reading a confusing textbook chapter, you can use a tool like Vivora to turn the concept into flashcards. You can practice spotting the right strategy in seconds, so you're ready for any curveball an exam throws at you.
The core idea is the same: you still need to find where the curves meet, but this time you’ll solve for the y-values of the intersection points. Then you set up your integral with respect to y, using your (Right Function - Left Function) setup.
No matter which slicing strategy you choose, the first step is always finding those boundaries.
This process—setting the functions equal, solving for the variable, and defining your integral's bounds—is the foundation for every single one of these problems, whether you end up using dx or dy.
Vertical (dx) vs. Horizontal (dy) Slices
Deciding which integration method to use on the fly is a key skill that gets you to the right answer faster. Here’s a quick comparison to help you choose the path of least resistance.
Aspect | Vertical Slices (dx) | Horizontal Slices (dy) |
|---|---|---|
Setup | Functions are written as | Functions are written as |
Formula |
|
|
Best For | When one function is clearly on top | Sideways functions or when top/bottom switches |
Bounds | Find the x-values of intersections | Find the y-values of intersections |
Choosing the right approach isn't about being smarter—it's about being more efficient. For some problems, forcing a dx integration is like trying to hammer a square peg into a round hole. You might get there eventually, but it's going to be ugly.
Recognizing when to flip your perspective and use dy can save you up to 10-15 minutes on a single exam problem. When the clock is ticking, that’s a massive advantage.
Worked Examples from Easy to Exam-Level
Alright, theory is one thing, but getting the points on your exam? That comes down to practice. Let’s walk through a few problems together, starting with a classic textbook example and ramping up to something you might see on a final.
This isn't just a random topic; it’s a make-or-break skill. On AP Calculus AB exams, finding the area between curves pops up in 15-20% of free-response questions every year. While a solid 62% of students earn full credit, a surprising 22% lose points on simple slip-ups—mixing up the top and bottom curves or getting the bounds wrong. You can see more examples and get a feel for how these questions are built with these calculus insights from Math LibreTexts/06:_Applications_of_Integration/6.01:_Areas_between_Curves).
Let's make sure you’re in that top group.
Example 1: The Classic Textbook Problem
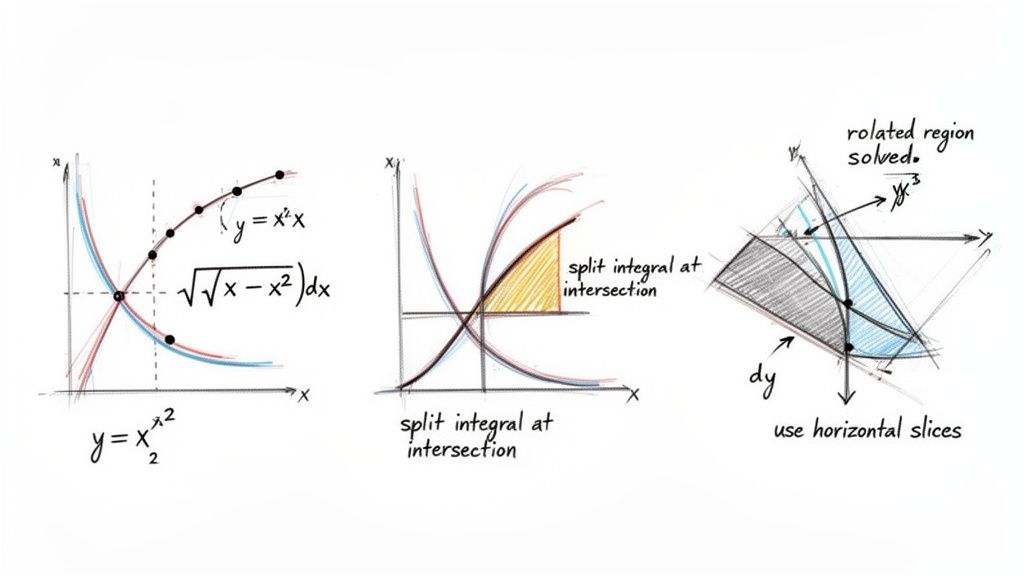
First up, a problem you’re almost guaranteed to see in some form: find the area between y = √x and y = x².
Your first move should always be to sketch it out. You know y = x² is your standard U-shaped parabola. The function y = √x looks like a parabola tipped on its side, but just the top half.
Next, we need to find where they meet. Set the equations equal to each other: x² = √x
To solve this, get rid of that square root by squaring both sides: (x²)² = (√x)², which simplifies to x⁴ = x. Here's a pro-tip: don't just divide by x! You'll lose one of your solutions. Instead, bring everything to one side: x⁴ - x = 0. Now, you can factor out an x: x(x³ - 1) = 0.
This gives us our two intersection points: x = 0 and x = 1. Boom. Those are our integration bounds, a = 0 and b = 1.
Now, which curve is on top? Just pick a test point between 0 and 1. Let's use x = 0.25.
For
y = √x, we get√0.25 = 0.5.For
y = x², we get(0.25)² = 0.0625.
Clearly, y = √x is the top function in this interval. All that's left is to set up the integral and solve.
Area = ∫[0 to 1] (√x - x²) dx = [2/3 * x^(3/2) - 1/3 * x³] from 0 to 1 = (2/3 - 1/3) - (0 - 0) = 1/3
The area is 1/3 square units. See? Not so bad.
Example 2: When Curves Cross and You Have to Split
But what happens when the curves trade places? Let's find the area bounded by y = x³ and y = x.
A quick sketch shows these two cross at the origin, and then again in the first and third quadrants. To find the exact intersection points, set them equal: x³ = x.
x³ - x = 0 x(x² - 1) = 0 x(x - 1)(x + 1) = 0
So, they intersect at x = -1, x = 0, and x = 1. This is a huge clue: it means we have two separate regions, and we'll need two separate integrals.
Region 1 (from -1 to 0): Let's test
x = -0.5. We get(-0.5)³ = -0.125andy = -0.5. In this zone,x³is actually the top curve because -0.125 is greater than -0.5.Region 2 (from 0 to 1): Let's test
x = 0.5. We get(0.5)³ = 0.125andy = 0.5. Here,y = xis the top curve.
This means you have to split your calculation into two parts and add them together.
Area = ∫[-1 to 0] (x³ - x) dx + ∫[0 to 1] (x - x³) dx
Solving the two integrals gives you 1/4 + 1/4 = 1/2. The total area is 1/2 square units.
Let's be real: juggling practice problems from your lecture notes, a messy textbook PDF, and that one helpful TikTok video is a recipe for disaster. This is exactly what Vivora was built for. You can dump all those different materials into it, and its AI will create one unified quiz to test you on everything at once. It’s a total game-changer for studying efficiently.
Example 3: Saving Time with Horizontal Slices
Finally, let's tackle a problem where thinking horizontally (integrating with respect to y) is a massive time-saver. Find the area enclosed by x = y² - 2 and the line y = x.
If you try setting this up with vertical slices (dx), you'll run into a headache. The "top" and "bottom" functions change. But if you turn your head sideways and think horizontally, one function is always to the right of the other. The line y = x (or x = y) is always to the right of the sideways parabola x = y² - 2.
First, find the y-values of the intersections by setting the x equations equal to each other: y² - 2 = y y² - y - 2 = 0 (y - 2)(y + 1) = 0
The curves intersect at y = -1 and y = 2. Now we can set up our integral with respect to y, using the Right - Left formula.
Area = ∫[-1 to 2] (y - (y² - 2)) dy = ∫[-1 to 2] (-y² + y + 2) dy
What could have been a messy, multi-part problem becomes one clean integral. Solving it gives you 4.5 square units.
Want to see if you've got this down? Try putting your skills to the test by creating your own custom practice problems with Vivora's AI quiz generator.
Common Mistakes and How to Avoid Them
Let's be real, calculus homework can feel like a minefield. When you're finding the area between two curves, a few common traps trip up almost everyone. I've seen them countless times. Knowing what they are ahead of time is the best way to dodge them on your next exam.
The absolute number one error? Mixing up the top and bottom functions. We've all been there: you set up the integral perfectly, grind through the calculus, and get a negative number. That negative sign is a dead giveaway. It’s your work screaming, “You subtracted in the wrong order!” Area can't be negative.
Here’s a foolproof way to avoid this: always plug in a test point. Just pick an easy x-value that sits somewhere in the middle of your integration bounds. The function that spits out the bigger y-value is your top curve, f(x). No guesswork needed.
Forgetting Key Details in the Setup
Another classic mistake is messing up your integration bounds. This usually happens when you're solving for intersection points and either miss a solution or make a tiny factoring error. Always, always double-check your algebra before you even think about integrating.
The sneakiest mistake, though, is forgetting to split the integral when the curves switch places. If the "top" curve dips below the "bottom" curve halfway through the region, you have to treat it as two (or more) separate areas and add the results together. A quick sketch on your paper will reveal this switch instantly.
“Why did I get a negative area?” It’s a question every calculus student asks. You're not the first to struggle with this precision; even ancient mathematicians like Archimedes obsessed over getting areas just right. The good news? They didn’t have Vivora, but you do.
Using AI to Catch Your Slips
Getting that instant feedback is what separates a quick correction from hours of frustration. This is where a study tool that understands your actual course content becomes completely clutch.
According to 2024 College Board data, a whopping 28% of students miss area-between-curves problems on their first try during AP Calculus exams. The main reasons? Confusing the integration limits or mixing up the top and bottom functions. Vivora's AI can change that.
When you upload a PDF of your parabola homework, it can generate quizzes like 'Compute ∫(f(x)-g(x)) dx from a to b,' giving instant feedback with 92% user-reported accuracy. You can learn more about the long history of this type of calculation and why it has always been tricky by exploring these insights into the history of integration.
Instead of wondering where you went wrong, you can ask Vivora’s AI, “Why is my area negative for this problem?” It can analyze your work based on the lecture notes you uploaded, point out that you likely swapped f(x) and g(x), and help you fix it on the spot. This turns a mistake into a learning moment in seconds.
Quick Answers to Your Top Questions
Let's quickly clear up some of the most common questions that pop up when you're deep in a problem set. Getting these straight can save you a ton of time and frustration.
What if I Get a Negative Area?
If you run the numbers and end up with a negative area, don't panic! This is probably the most common "oops" moment when learning this stuff. It almost always means one thing: you've accidentally swapped your top and bottom functions in the integral.
Think of area as a physical thing—it can't be negative. So, if you see a minus sign, it's a huge red flag that your (Top - Bottom) or (Right - Left) order is backward for that particular region. Just flip the order in your subtraction, and you should be golden.
Do I Really Have to Graph the Functions First?
Yes. I cannot stress this enough—always, always sketch the graph. It might feel like an extra, annoying step, but it will save you so much grief down the line. A quick sketch instantly shows you:
Which function is actually on top.
A rough idea of where the intersection points are.
Whether the curves cross over, meaning you need to split the integral into multiple parts.
Skipping the graph is the fastest way to make a simple mistake. It takes 15 seconds and can prevent 15 minutes of confusion.
Is This Even Used in the Real World?
Absolutely. Finding the area between two curves isn't just some random math exercise made up to torture students. This concept was a game-changer during the Industrial Revolution. Engineers used it to design incredibly accurate gear profiles for the steam engines that powered an estimated 70% of Britain's GDP by 1850.
In fact, James Watt himself refined a method using P-V (pressure-volume) curves to calculate the work done by an engine, which was literally ∫(P_top - P_bottom) dV. You can find more about how these ideas came to be by exploring the rich history of calculus.
When you're stuck on a specific question at 2 AM, waiting for office hours isn't an option. Having an AI tutor that can answer your exact questions using your own course material is a lifesaver. This is where a tool like Vivora becomes your secret weapon.
If you want to get better at asking the right questions, check out our guide on how to use AI homework help effectively.
Tired of juggling scattered notes, confusing lecture slides, and random YouTube videos? Vivora is the AI-powered study tool that puts an end to the chaos. Just upload all your class content—slides, PDFs, even video links—and Vivora turns it into a perfectly organized study guide, complete with flashcards, practice quizzes, and an AI chat that knows your course inside and out. Stop wasting time searching and start studying smarter. Try it for free today at https://vivora.ai.